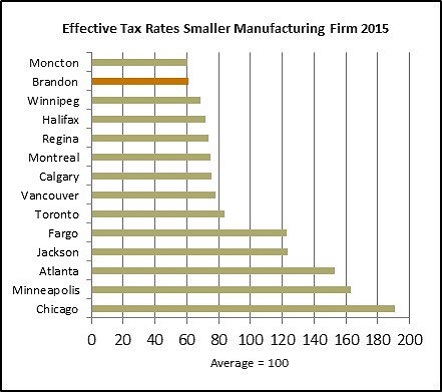
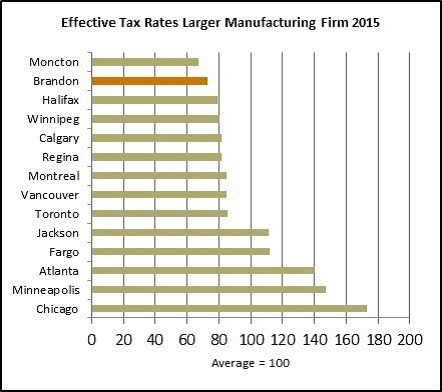
Brandon has the highest pre-tax net income for both the small and large manufacturing firms. A talented, well-educated and productive labour force, low utility costs and lower than average start-up costs contribute to the cost advantages of operating a manufacturing plant in Brandon. Overall competitiveness is measured by comparing internal rates of return and other factors.
The following six charts illustrate the combined effect of taxes and costs on the internal rates of return for the representative small and larger manufacturing corporations in the selected jurisdictions for 2015.
The Manitoba Provincial Government issued the Manitoba Advantage document annually with the Provincial Budget. 2015 was the last year this document was released.
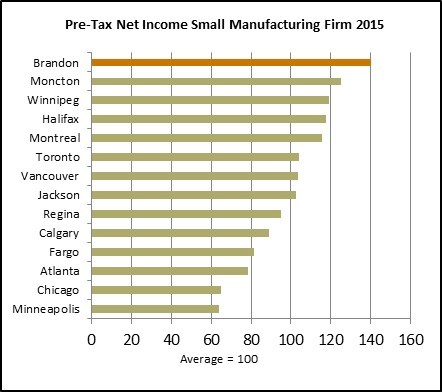
Source: Manitoba Finance, Manitoba Advantage 2015
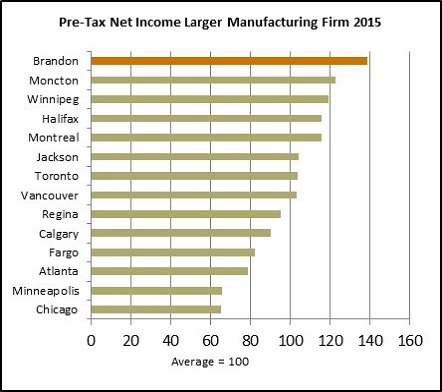
Source: Manitoba Finance, Manitoba Advantage 2015
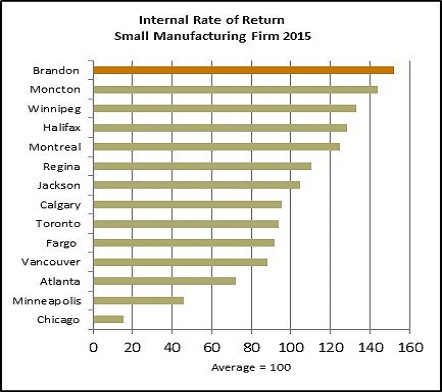
Source: Manitoba Finance, Manitoba Advantage 2015
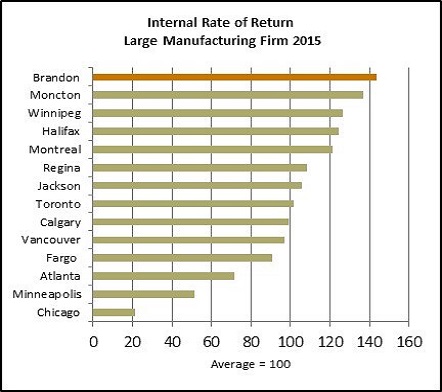
Source: Manitoba Finance, Manitoba Advantage 2015
Source: Manitoba Finance, Manitoba Advantage 2015
Source: Manitoba Finance, Manitoba Advantage 2015
| Canadian Urban Comparison of Operating Costs | |||||||
| Brandon | Truro | Belleville | Red Deer | Grande Prairie | Prince Albert | Regina | |
| Rank out of 34 Canadian cities surveyed by KMPG | 12 | 4 | 9 | 21 | 27 | 22 | 29 |
| Salary and Wages | 4,599 | 4,415 | 4,776 | 4,870 | 4,985 | 4,800 | 4,818 |
| Statutory Plan | 362 | 274 | 380 | 267 | 270 | 277 | 277 |
| Other Benefits | 1,120 | 1,182 | 1,183 | 1,232 | 1,261 | 1,211 | 1,216 |
| Total Labour | 6,081 | 5,771 | 6,339 | 6,369 | 6,516 | 6,288 | 6,311 |
| Facility lease | 276 | 261 | 215 | 316 | 295 | 257 | 448 |
| Surface Freight | 1005 | 976 | 682 | 894 | 930 | 1057 | 1004 |
| Air Freight | 190 | 163 | 149 | 180 | 188 | 197 | 192 |
| Total Transportation | 1195 | 1139 | 831 | 1074 | 1118 | 1254 | 1196 |
| Electricity | 79 | 166 | 181 | 150 | 168 | 142 | 142 |
| Gas | 33 | 90 | 41 | 24 | 24 | 35 | 35 |
| Total Utilities | 112 | 256 | 222 | 174 | 192 | 178 | 178 |
| Total Operating Costs | 7,664 | 7,427 | 7,607 | 7,933 | 8,121 | 7,977 | 8,133 |
*From the KPMG 2016 Competitive Alternatives study - cities were chosen as comparable locations to Brandon in terms of population and or geography. The cities above represent a comparable cross-section of cities from across Canada; some in terms of population and some in terms of geography: the table uses one city from Atlantic Canada, one city from Ontario, two from Saskatchewan, and two from Alberta. 2016 was the last year KPMG produced the annual report Competitive Alternatives.